User manual
Importing Observed Data
Import daily, monthly, or yearly monitoring data and connect it to reaches, reservoirs, and calibration workflows.
Observed data is important for model calibration. The most common observed data is flow. Sometimes, the water quality is also available. SWAT Output Viewer has the ability to display observed data with model outputs in the same graph and calculate performance statistics.
The observed data is imported in Project View, where the map of the watershed is given to select a reach or a reservoir that has observed data available. By default, all reaches and reservoirs are in blue as shown in Figure 5-1.
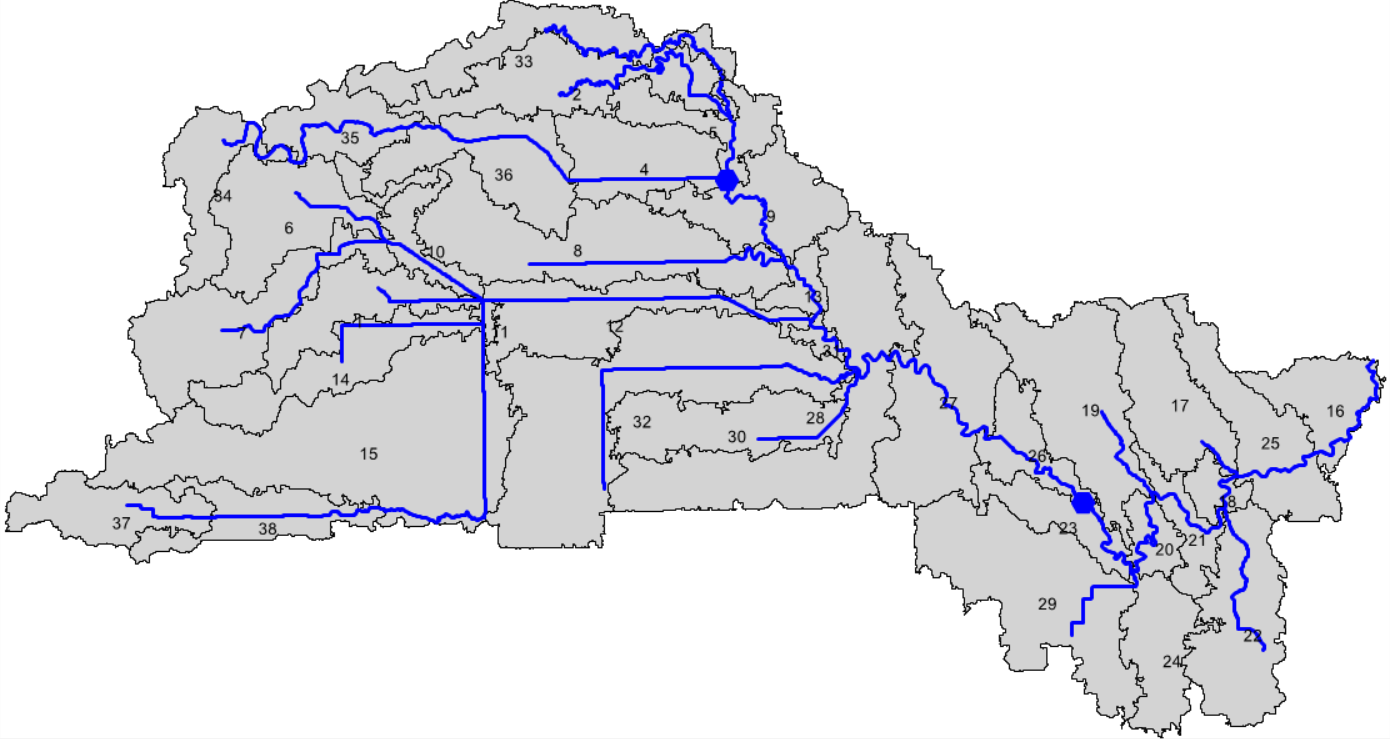
Figure 5-1. Watershed Map in Project View
Select a Reach or Reservoir
To select a reach or a reservoir, click the Select tool in the toolbar and click the desire reach or reservoir on map. The reach/reservoir will be highlight on map and the variable list in Observation section (located on right) becomes enabled. This list gives all available variables (flow, TSS, TN and TP) that could be linked to observed data.
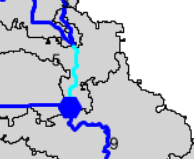
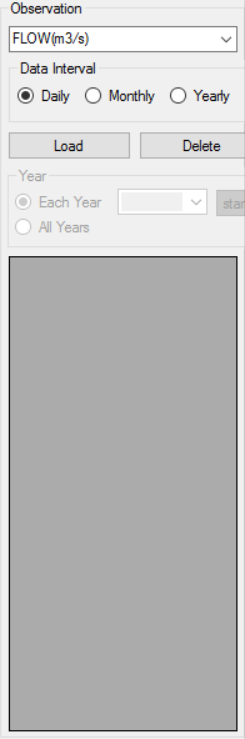
Figure 5-2. Map Selection and Variable List in Project View
Choose the Variable and Time Interval
Select right variable the observed data would be linked to. Make sure they are using same unit. And then select data interval the observed data used. By default, daily is selected, which means the observed data will be compared to daily outputs.
Load the Observed Data File
Click Load button to open the observed data file. Currently, only csv file is supported. The csv file should have two columns: date and data value. The first row is assumed to be column name and will not be read. The date format is given in Table 5-1, where yyyy is year, mm is month and dd is day.
Table 5-1 Date Format for Observed Data
| Time Interval | Date Format |
|---|---|
| Daily | yyyy-mm-dd |
| Monthly | yyyy-mm-01, yyyy-mm, mm--yyyy |
| Yearly | yyyy, yyyy-01-01 |
Review the Imported Data
A confirmation message window appears once the data is imported successfully and the data would be shown in graph located at bottom. The data is also shown in the table on the right. By default, all data is displayed. Data of certain year could be displayed by select Each Year. A simple statistic information is also shown in status bar. After the reach/reservoir has observed data, the map feature would become red.
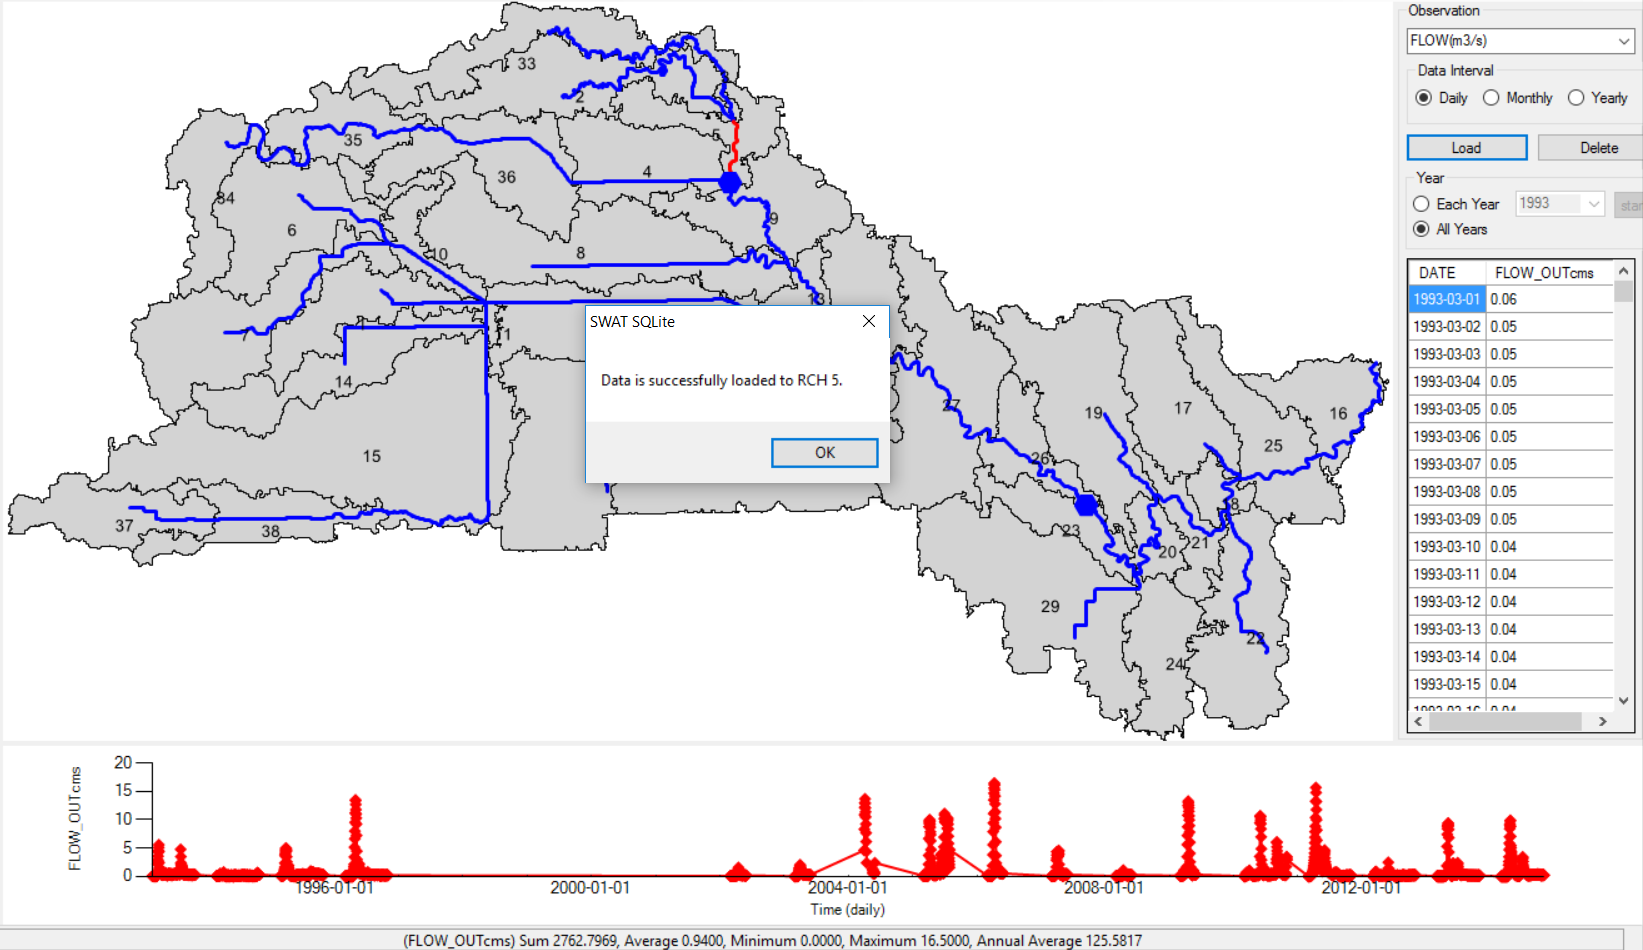
Figure 5-3. Confirmation Message and Time Series Graph in Project View
Continue to add more observed data to other reaches or reservoirs.
Data Storage and Reuse
The imported data is saved in a database located in Scearios folder. Separate databases are created for daily, monthly and yearly observed data. The data is only required to be imported once. It will be read automatically from the database.