User manual
Viewing Model Performance
Evaluate calibration results across locations and years with NSE, R², bias, RMSE, CVRMSE, NRMSE, and diagnostic plots.
The model performance statistics in subbasin, reach and reservoir view is only for selected subbasin, reach and reservoir. The performance view allows to view model performance statistics for all available locations. It’s the perfect place for modellers when they are doing model calibration.
The performance view is shown in Figure 9-1.
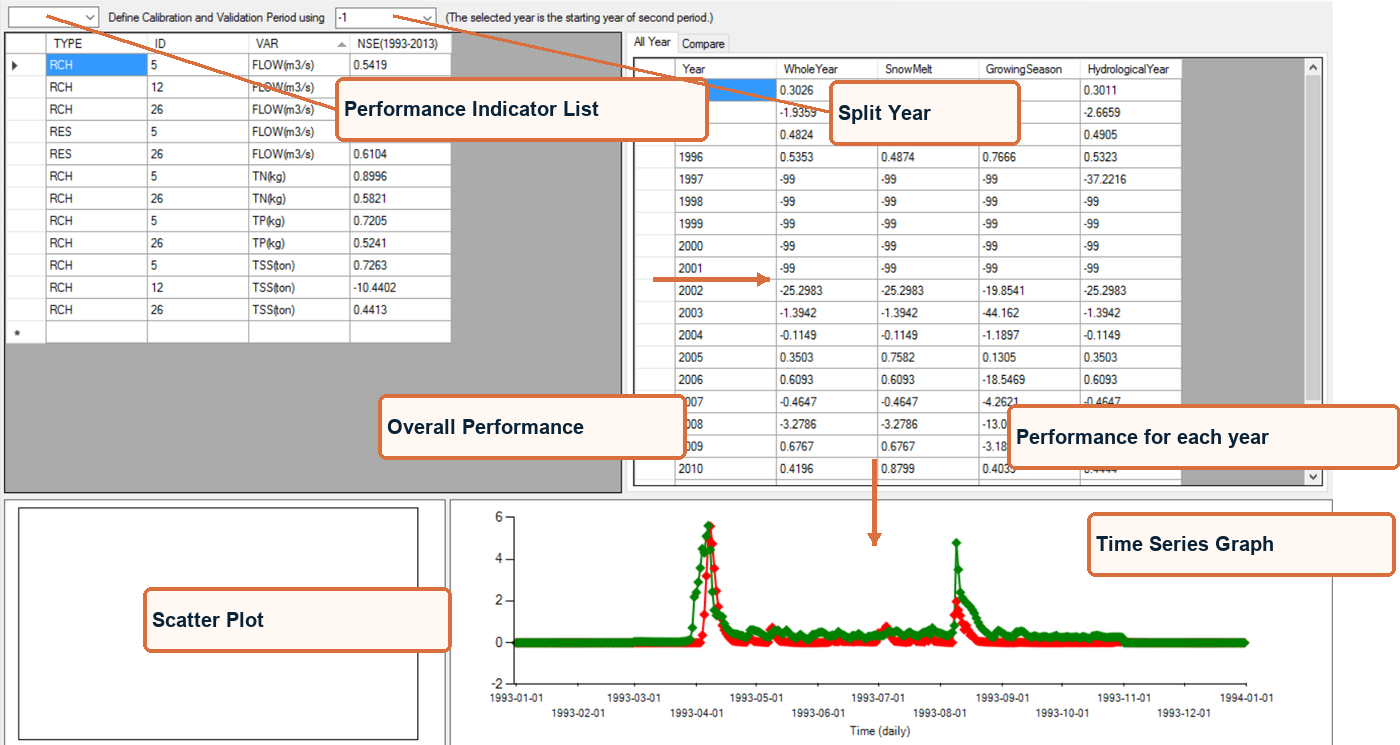
Figure 9-1. Performance View
The Overall Performance section lists the value of selected performance statistic for all available SWAT components in a table. Selecting one row in this table, the performance for each year is given in Performance for each year section located on the right. Selecting one year, the corresponding time series data would be displayed in Time Series Graph, which is similar to the one in subbasin, reach and reservoir view.
Six performance indicators are supported in current version. They are NSE, R2, Bias, RMSE, (CV)RMSE and NRMSE. And the NSE is the default one. These indicators could be switched by using the Performance Indicator List located on top. Figure 9-2 shows overall performance table when R2 is selected.
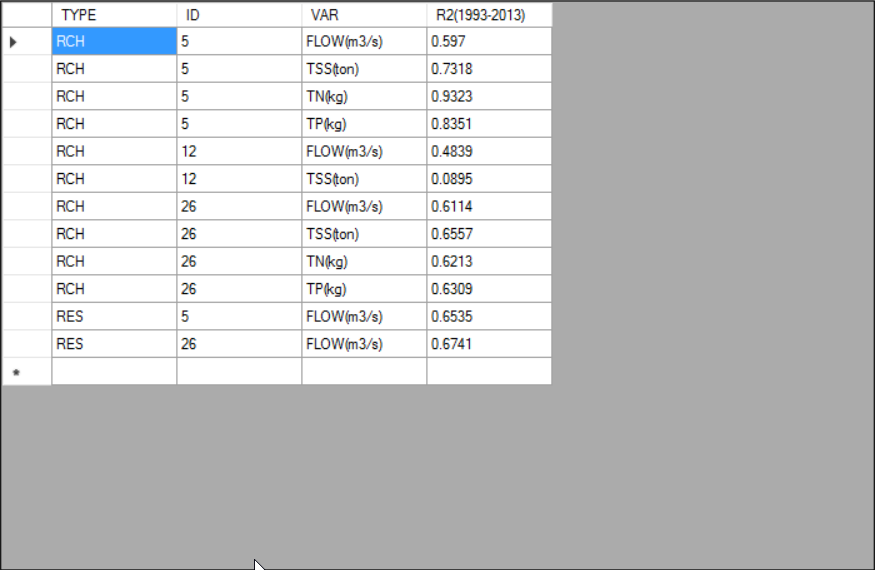
Figure 9-2. R2 in Performance View
A year could be specified to divide the whole time range to two time periods. The performance for these two periods will be calculated and added to the overall performance table (Figure 9-3).
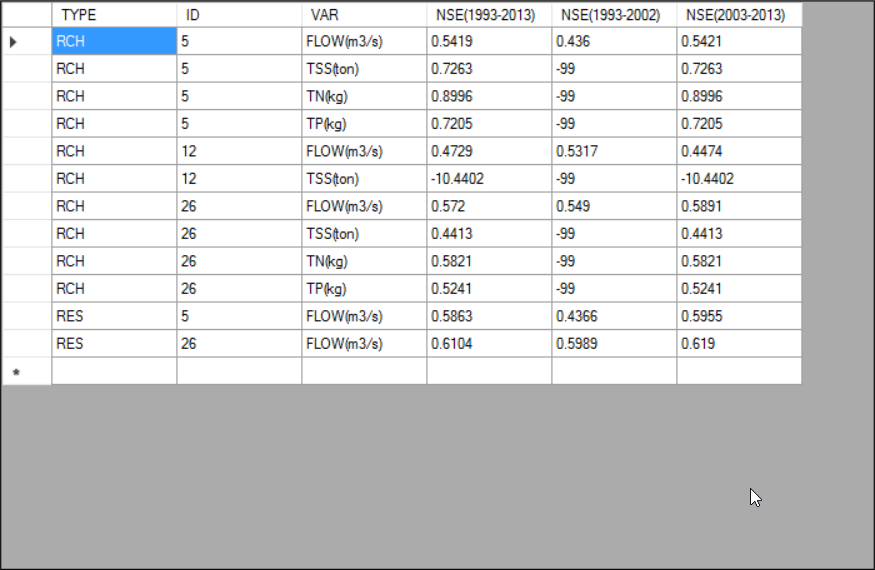
Figure 9-3. Over Performance Table with Year = 2003
The Performance for each year table lists the performance statistics of each year. In each year, four values are calculated for four seasons. The best year or the worse year could be found by sorting desired columns (Figure 9-4). Note that -99 means the observed data is missing for that year.
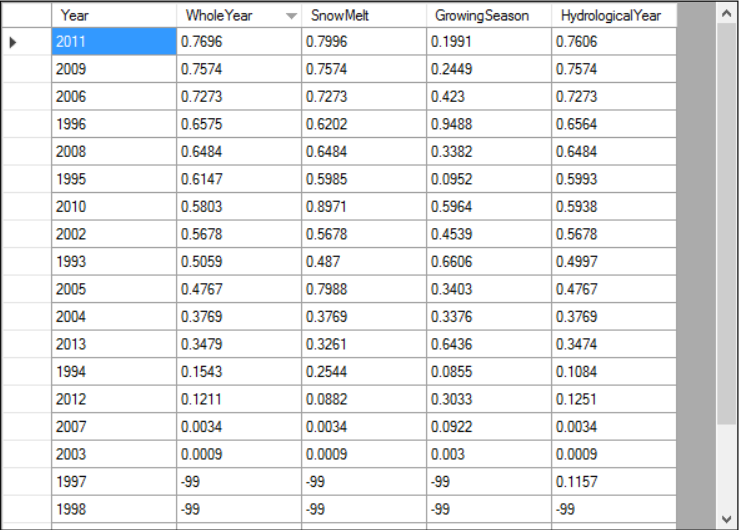
Figure 9-4. Performance from Best to Worst Year Sorted by Whole Year
There is another tab (Compare) in Performance for each year section. It compares the performance of current model and selected model engine or scenario (Figure 9-5). The usage of Compare with and Season section is same as the one in output views (see Defining Comparison Outputs and Defining Time Range). With a comparison model engine or scenario is selected, the time series data from the comparison dataset is also added to the time series graph (in blue).
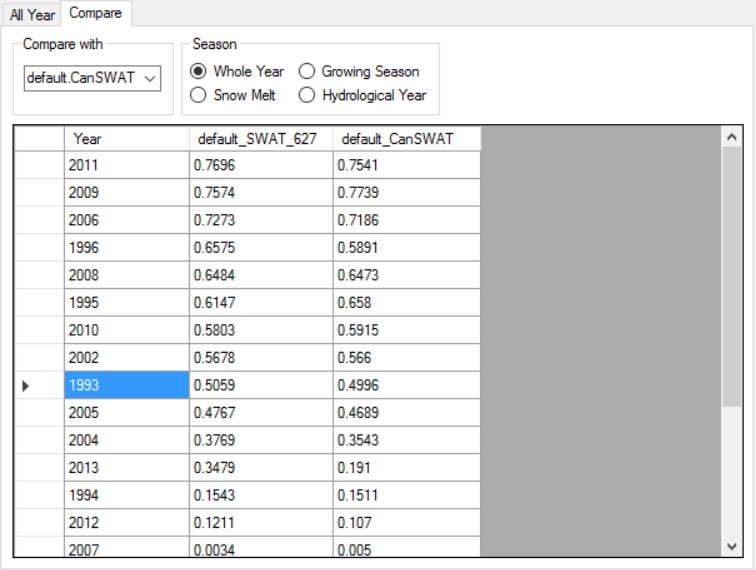
Figure 9-5. Mode Performance for Different Model Engine
The Scatter Plot is for TSS, TN and TP, which usually has fewer observed data compared to flow. Selecting row in Overall Performance table would update this plot (Figure 9-6). Note that both axis are using logarithm.
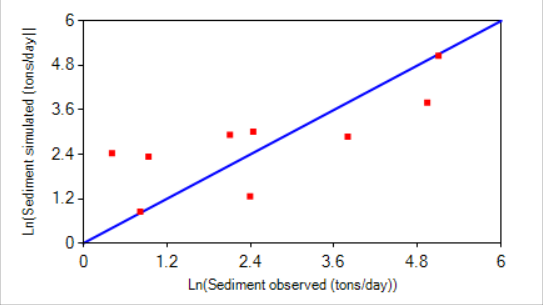
Figure 9-6. Scatter Plot for TSS in Performance View